Results
This section provides a basic overview of the study’s main findings. More detailed tabular presentations of the results can be found in Appendix F. Table 2 presents some general descriptive data about each of the three communities, such as population, number of journalism sources identified, number of sources per 10,000 capita, and the proportional participation of these sources on the two major social media platforms (Facebook and Twitter). These data speak to the relative health of the Infrastructure Layer of the local journalism ecosystems across these three communities.
Table 2: Descriptives
| Town | Population | Per Capita Income | # Journalism Sources | Sources/10k | Social Media Presence Score |
| Newark | 277,00 | $13,009 | 16 | .58 | 80 |
| New Brunswick | 55,000 | $16,395 | 13 | 2.36 | 81 |
| Morristown | 18,000 | $37,573 | 11 | 6.11 | 68 |
One point worth noting in this table is the substantial variation in the number of sources per 10,000 capita across these three communities. As the table indicates, the smallest, wealthiest community (Morristown) has, proportionally, substantially more journalism sources than the largest, lowest-income community (Newark), with New Brunswick situated between the these two communities in terms of population, per capita income, and sources per 10,000 capita.[1] As we will see, this disproportionate availability of local journalism sources dramatically impacts the volume of journalism output across these three communities (see below).
Next, we look at the overall levels of journalism activity across the three communities. Here, we control for population size in order to have a relative sense of the quantity of journalism output being produced, both in overall terms and in terms of journalism meeting the various criteria – and combinations of criteria – discussed above (e.g., original, about community, meeting critical information needs). We look first at our analysis of stories available on the journalism sources’ home pages. We then turn to the journalistic output on social media platforms
[1] It is important to note that there are a number of radio stations licensed to the city of Newark, but many of these stations’ studios and transmission towers are based in New York City, and the stations essentially operate as New York City-focused radio stations. These stations (e.g., WQXR, WNSH, WHTZ) were not included in this analysis as local journalism sources for Newark.
Web Sites
Figure 2 depicts the differences in journalistic output across the three communities, with a focus on the news stories that were present on the home pages of the sources located within each community. This graph provides breakdowns across each individual coding category, as well as all combinations of coding categories. At the most basic level (the top category in the graph) – stories per 10,000 capita – we can see that Morristown journalistic sources presented nearly 200 stories per 10,000 capita in the sample week, compared with less than ten for Newark and approximately 80 for New Brunswick.
Figure 2: Journalistic Output Per 10,000 Capita Across Three NJ Communities (Web Sites)
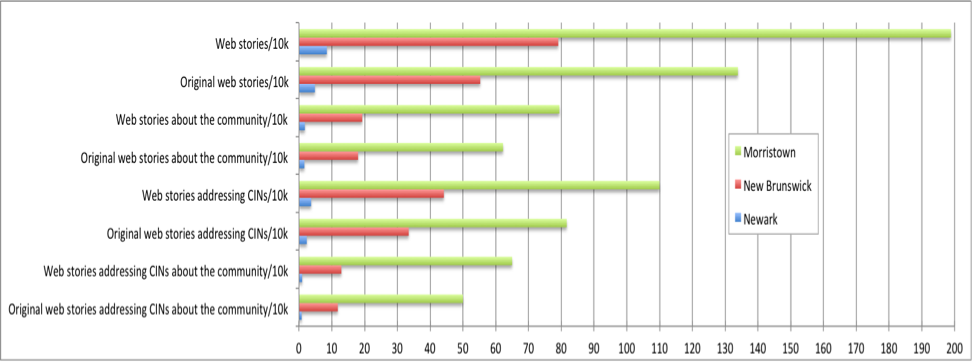
Figure 3: “Quality” of Journalistic Output Across Three NJ Communities (Web Sites)
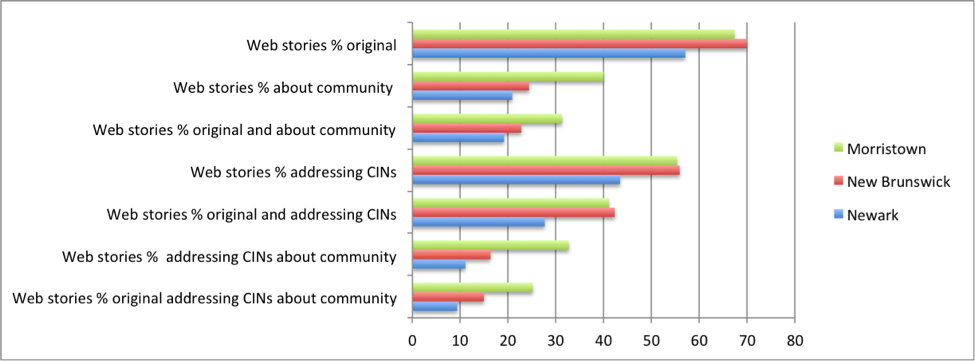
Starting at the top of the graph, for instance, the percentage of news stories produced by Morristown journalism outlets that was original approached 70 percent. In terms of originality, the proportion of news stories produced by New Brunswick journalism sources meeting this criterion was slightly higher (70%). For Newark the proportion was just under 60 percent. As Figure Three also indicates, while over 30 percent of the Morristown news stories analyzed were about the community and addressed critical information needs, this percentage was less than 20 percent for New Brunswick and just over ten percent for Newark.
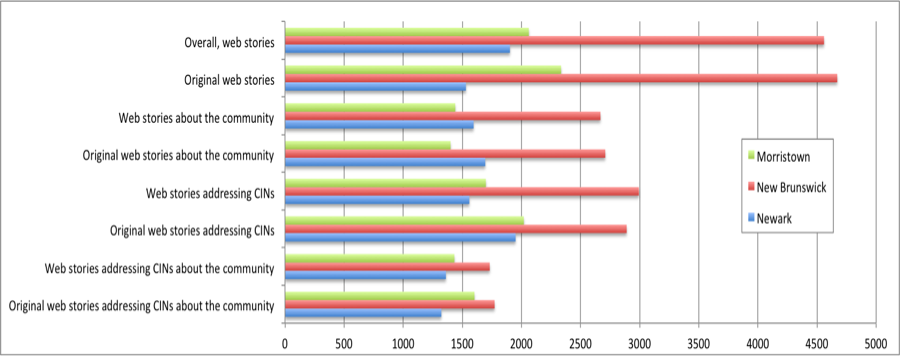
Finally, we look at the concentration of the journalistic output found on the home pages for the local journalism sources. As Figure 4 indicates, New Brunswick exhibited consistently higher levels of output concentration than either Newark or Morristown across all of the content coding categories. So, for instance, New Brunswick’s HHI for web story output was 4559.18, compared with 2062.20 for Morristown and 1902.58 for Newark. The levels of output concentration in Newark and Morristown tend to be similar. These patterns suggest, compared to Morristown and Newark, a substantially larger proportion of the journalistic output in New Brunswick is produced by fewer sources.
Figure 4: Concentration of Website Stories Across Three NJ Communities
Social Media
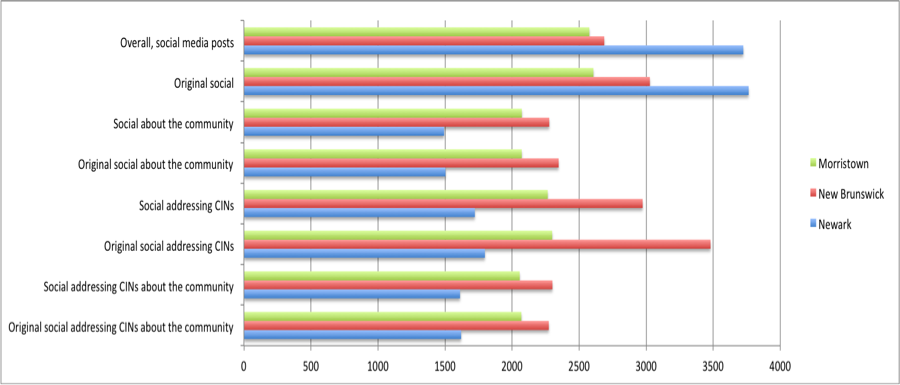
We turn next to social media output. Figure 5 presents the same breakdown as Figure 2, with the focus this time on social media posts rather than stories available on the sources’ home pages. As should be clear from Figure 5, the same pattern that was found for home page output persists when we focus on the social media output of these journalism sources. The social media output of Morristown’s journalism sources far exceeds that of Newark and (to a lesser extent) New Brunswick across all of the coding categories, ranging from the broadest (posts per 10,000 capita) to the narrowest (original posts about the community addressing critical information needs per 10,000 capita). For instance, Morristown journalistic sources produced over 200 posts per 10,000 capita addressing critical information needs during the measurement period, compared with 60 for New Brunswick and less than ten for Newark.
Figure 5: Journalistic Output Per 10,000 Capita Across Three NJ Communities (Social Media)
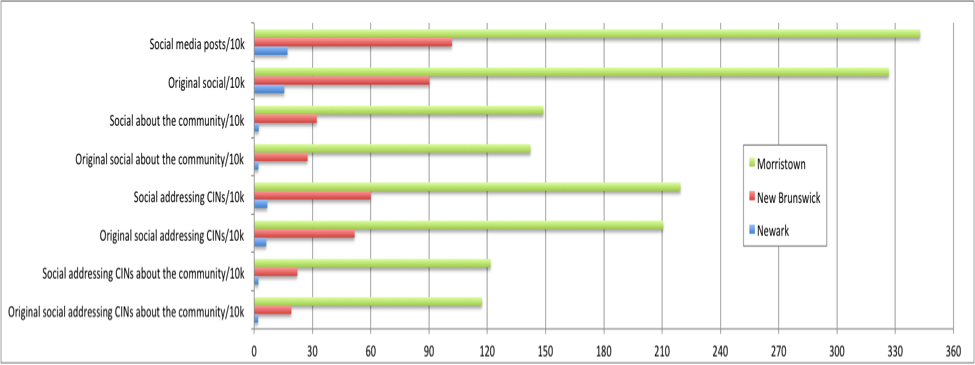
Figure 6: “Quality” of Journalistic Output Across Three NJ Communities (Social Media)
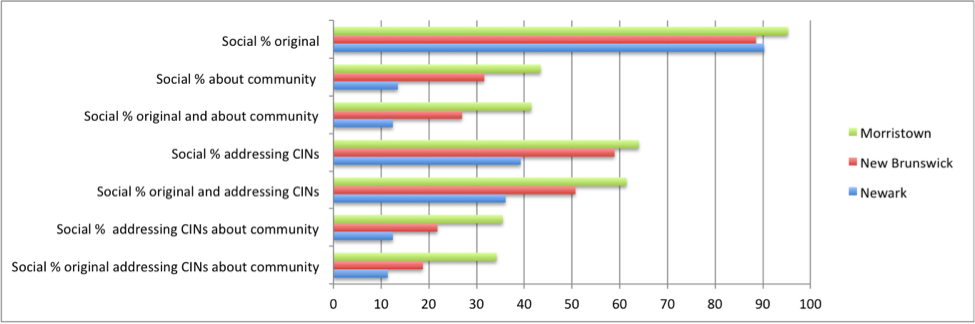
Figure 7: Concentration of Social Media Output Across Three NJ Communities